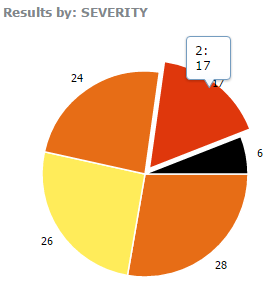
The Reviewer Dashboard widget displays data quality result statistics as infographics, such as pie and bar charts, to summarize data quality issues identified in your GIS data. The statistics represent total counts of results summarized by a field that allows you to understand the number and type of results present in your data.
License:
The Reviewer Dashboard widget requires the ArcGIS Data Reviewer for Server extension.
The widget supports both spatial- and attribute-based filtering of results. This allows you to visualize result statistics by a specific area or attribute. You can spatially filter results by the following:
- Current map extent
- Selection area drawn on the map
- Selected features in a polygon map service layer
By default, there are seven fields by which the Reviewer results can be summarized and filtered. These fields are as follows:
- CHECKTITLE
- FEATUREOBJECTCLASS
- LIFECYCLESTATUS
- SESSIONID
- SEVERITY
- SUBTYPE
- LIFECYCLEPHASE
If there are custom fields defined for your results, they will be added automatically to the fields' summary list. For more information, see Adding custom fields to the Reviewer table .
Configuring the Reviewer Dashboard widget
This widget can be set to open automatically when
an app starts. Click the Do not open this widget when
the app starts button  on the widget to turn on the option to open the widget automatically. (For widgets you need to add to the app first, you can make this setting after configuring the widget.)
- Hover over the widget and click the Configure this widget button
 to open the configuration window.
Note:
If you need to add the widget to the app first, click a widget placeholder on the Widget tab. In the Choose Widget window that opens, select the widget and click OK.
- Optionally click the Change widget icon button and replace it with your own image. A file explorer window opens, allowing you to select a local image file to use as the widget icon.
- Provide the Data Reviewer for Server SOE URL, and click Set.
- Type the number of segments to display in the pie chart graphical representation of results summaries. The maximum number of segments is 10 and the default is 5. If there are more than five segments in the chart, a category called Other will contain the additional results data and will display in the drill-down view.
- The Include filter by geography check box is selected by default in the widget.
- To keep the default setting and filter by geography, either enter a new URL in the Service for filter by geography text box for the map service, or keep the current (default) URL.
- Since the map service must contain a polygon layer to filter Reviewer results, enter the layer in the Service layer for filter by geography text box.
- Provide a URL to a geometry service in the Geometry service URL text box.
- Alternatively, you can remove the filtering by geography behavior completely from the widget by unchecking the Include filter by geography check box.
- To have the chart open with a certain field, click the radio button in the Default column that corresponds to the Dashboard Field Name.
- To set the visibility of a field, use the check box in the Visible column next to its Dashboard Field Name.
- To set the Field Name Alias, use the Alias column, double-click the current name, and make your edit.
- Click OK to save and close the Reviewer Dashboard widget configuration window.
Using the Reviewer Dashboard widget
- The widget opens with a graphical representation of Reviewer Dashboard results displaying on the selected field. Hover over a segment in the pie chart to view additional details about each attribute property.

- You can toggle two visualizations of result summaries: pie and bar charts.
- Click Other to refresh the pie chart to display segments that are greater than the default value set in the original configuration.
- Click the Settings tab to view results from a different field. Click the radio button next to the field name you want to view.
- You can filter the overall results by geometry in one of the following ways:
- Draw a selection area on the map—Limits the display to results found only within that selection.
- Show results in the current map extent—The chart updates to display summarized results in the current map view.
- Show results by geography—Click any area in the map, and the chart updates to display summarized results only within that area.
- Use no spatial filter—Clears any spatial filter previously applied to the chart.
- You can also filter results by reviewer session. Use the drop-down menu to choose either All Sessions or the specific session you want to view from the list of available sessions.